
Matt Kaneshiro
July 13, 2021
The United States (U.S.) Decennial Census plays an integral role in allocating government funds to ensure that the population has adequate resources for domains including infrastructure, education, and political representation. An accurate count ensures that the public is allotted its fair share of resources, while an inaccurate count or transitory snapshot will leave areas with undercounted populations or temporarily low population counts left out. For 2020, those left out include the residents of Arizona, Texas, and Florida – all states with large Hispanic populations. Had the Census Bureau’s Population Estimates been accurate (which they have been for 2010), each of these states would have had an extra seat in Congress as well as more federal funding for a variety of programs. There are two dynamics that appear to have led to the discrepancy between the 2020 Population Estimates (or “Estimates,” released in December 2020) and the 2020 Decennial Census results (or “Census results”, released later in April 2021): temporary migration patterns and immigrants’ fear of the federal government.
Census undercount was the first thing that came to mind after viewing the Census results. As a population scientist, I have written about how the Immigration Reform and Control Act of 1986 had contributed to the undercount of the 1990 Census relative to the 2000 Census. This undercount was found for cohorts that fit the stereotypical image of the “undocumented immigrant”. While COVID-related migration patterns certainly affected the 2020 Census, the older narrative remains compelling: fear of the federal government likely led to Census undercount for high Hispanic states.
Our best proxy for population over/undercount and unexpected migration patterns is the percentage difference (or “% Difference”) between the Estimates and the Census. Interesting relationships are revealed when comparing % Differences by state on two dimensions: Net Outflow/Inflow (using the 2019 American Community Survey microdata) and ethnicity (using the Population Estimates).
The Reversal of “High Net Outflow” States’ Normal Out-Migration Patterns

With our first cut of data, we group states by whether their migration patterns feature more out-migrants than in-migrants (“Net Outflow”) or vice-versa (“Net Inflow”). The Net Outflow group is then further equally divided into two groups based on their rates of net outflow: “Low Net Inflow” (in blue) and “High Net Outflow” (in green). The High Net Outflow group (of which New York is a member)had notably higher Census results than Estimates (+2.18%) while the Net Inflow group had negligible differences (+.12% difference). The Low Net Outflow group’s differences lay between the two estimates at +.64%. This suggests that states that normally export students and workers received these former relocators back to their home states after COVID-related school closures and job losses. These former relocators contributed to their home states’ Census counts, even though these are the same people that may later relocate to another state.
Missing Hispanics in “Net Inflow” States
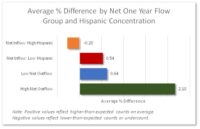
More interesting patterns are revealed when breaking up the “Net Inflow” group into two equally sized groups based on the concentration of Hispanic residents: “Net Inflow: High Hispanic” and “Net Inflow: Low Hispanic.”Here the notable figure is the low Census result for the “Net Inflow: High Hispanic” states (0.28%lower than the Estimates), suggesting either undercount or lower-than-expected net migration. The decline of employment opportunities and COVID-related travel restrictions may partially explain this finding as greater numbers of immigrants may have left the U.S. while fewer entered. An alternate explanation is that Hispanics feared that the Census would be used as a tool to identify, track, and punish the undocumented population. This may have led some Hispanics to boycott the Census, leading to lower population counts for high Hispanic states.
Conclusion: Reading Between The Lines
For better or for worse, the people have been deemed counted and congressional seats have been allocated. Districts will be drawn, and funding will be doled out based on the results of the Decennial Census – no matter how imperfect they may be. States like Arizona, Texas, and Florida will need to make do with their population counts and whatever federal funds they will have at their disposal to cater to their populations, including those who did not participate in the Census.
These results should be taken as preliminary as we need more data to demonstrate with more certainty that immigrants’ fear of the Census led to undercounting. However, I personally would be hesitant to provide my name, citizenship status, and address to the very government that had separated my brethren from their children and had labelled me a rapist.

Matt Kaneshiro has a Ph.D. in Sociology from the University of California, Riverside, and currently serves as the Senior Manager of Predictive Analytics for Customer Analytics, LLC. Along with building Machine Learning models, Matt produces population estimates for the U.S.